

Spend money where it
actually matters.
We tell you which assets are most likely to fail next, what it'll cost when they do, and where your money goes furthest. Less firefighting. Fewer surprises at the board meeting.
Designed for asset-heavy facility portfolios
What changes when you use Rivolq
Five things you stop losing sleep over.
The riskiest, costliest asset rises to the top.
How it works
From facility data to a plan you can defend.
Rivolq risk engine
one model · every asset
01
Plug in your data
CMMS, inspections, asset records.
02
Score what breaks
Condition, age, dependency.
03
Put a dollar on it
Replacement, downtime, cascade.
04
Hand finance a plan
Ranked, with the reasoning.
See the platform
From asset list to ranked capital case, in one walkthrough.
Model downstream operational impact before failure occurs — blast radius, exposure, and the path to recovery.
Live impact model · playing
What you actually get
Pay once, on your schedule. Not twice, on theirs.
Know what is most likely to break, and what it costs when it does.
Every asset gets a score you can defend. The reasoning is there if anyone asks.
How scoring works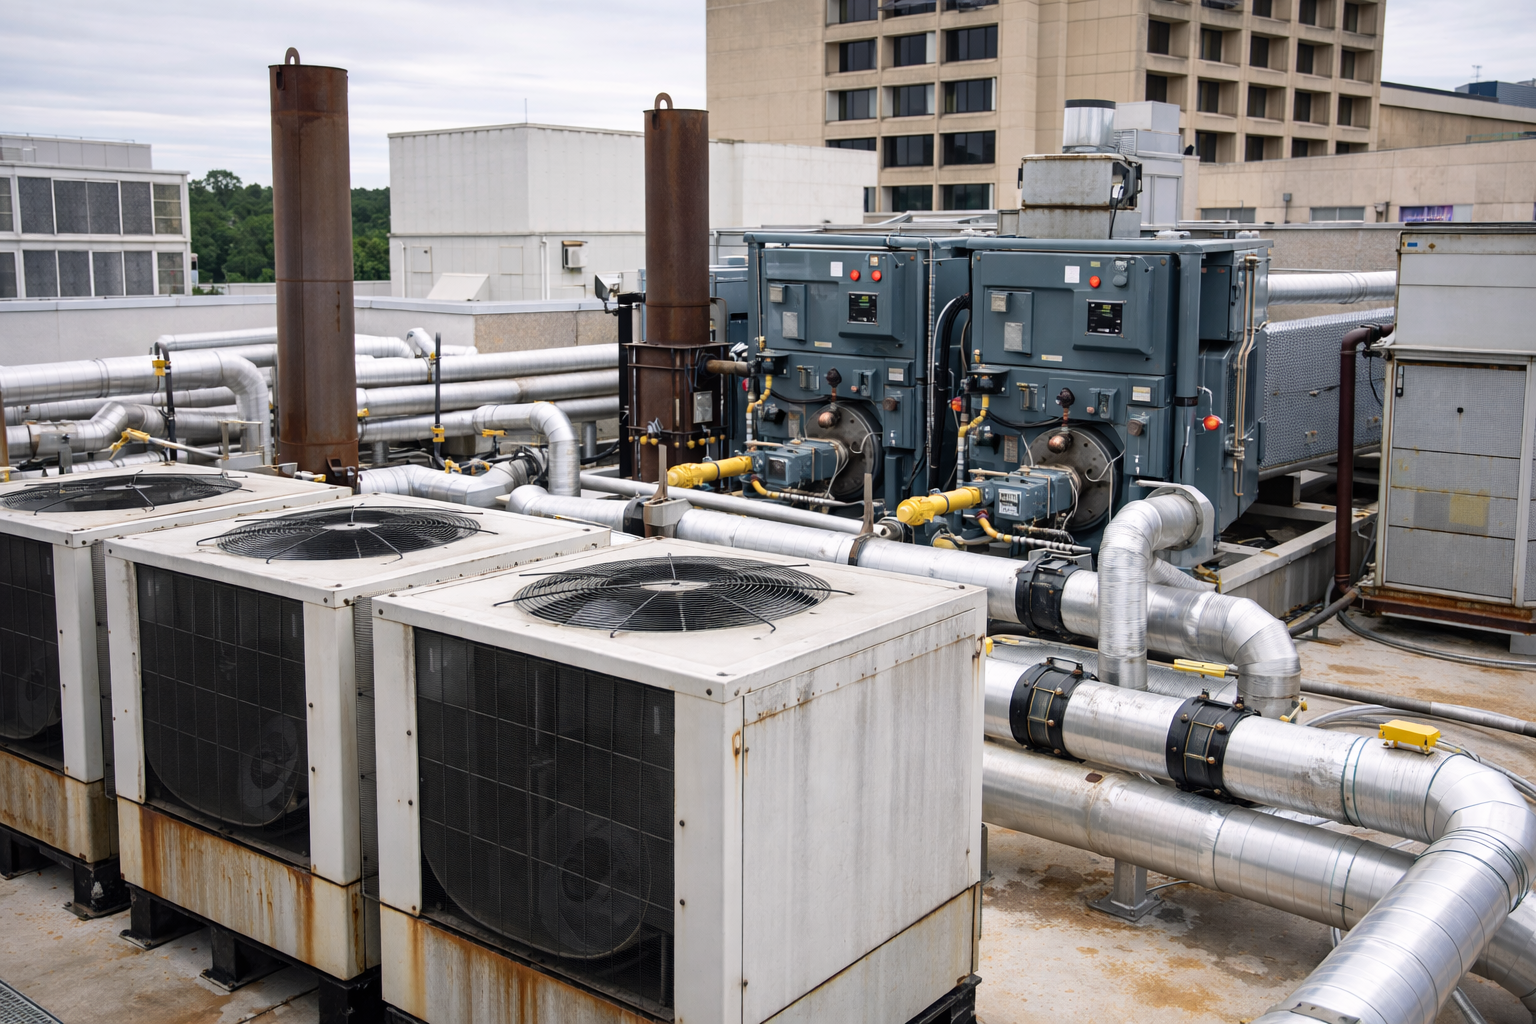
Ranked watchlist · 9-driver model
Justify every dollar before the meeting, not during it.
Priorities ranked by what they protect, what they cost, and what happens if you wait.
How planning works
Capital review · Q3 board cycle
Run daily operations on the same record finance approves.
Work orders, PMs, parts inventory, and a 3D facility model. All on one asset record your CFO can see.
How CMMS fits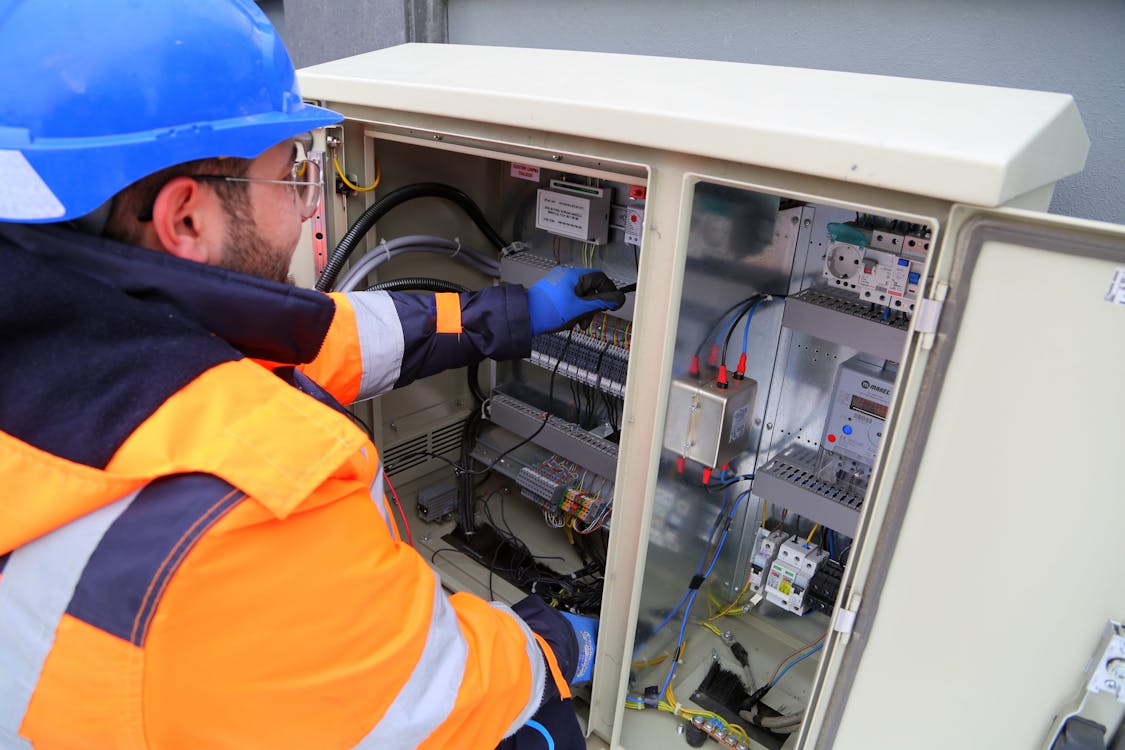
Field inspection · live work order
The Rivolq advantage
Built for the conversation between operations and finance.
Planned vs. emergency
Industry benchmark for the cost premium when failure forces the timing.
Risk drivers
Modeled behind every asset score. Every one of them traceable.
To a capital case
From kickoff to a plan your board will sign.
Surfaced exposure
Avoided emergency cost we projected in a first-facility pilot.
What IT and procurement will ask about
Built for the procurement review, not just the demo.
Pilot delivery timeline
90 days from kickoff to a plan you can take to the board.
Weeks 1–2
Asset ingestion
We pull your CMMS records, inspections, and asset history into one place.
Weeks 3–5
Risk modeling
We score every asset on what makes it likely to fail.
Weeks 6–8
Exposure ranking
Your team walks the list with us. The ones we got wrong, we fix.
Weeks 9–12
Executive reporting
A ranked plan your CFO can defend. You keep every file, either way.




Works with what you already run
Your building systems. Your finance stack. Your data warehouse.
Building systems


Enterprise software






Cloud + data





These are systems we're built to work alongside. Not all are existing partnerships. Ask us about your stack and we'll tell you straight.
Updated 2h ago · refreshes daily
Start with one facility
See it work on one of your buildings.
We scope it tight. 90 days, one facility, a plan you can take to the board. Every file is yours, whether you continue or not.